The Debugger
It's finally here: Native support for debugging across multiple programming languages, out now in Zed.
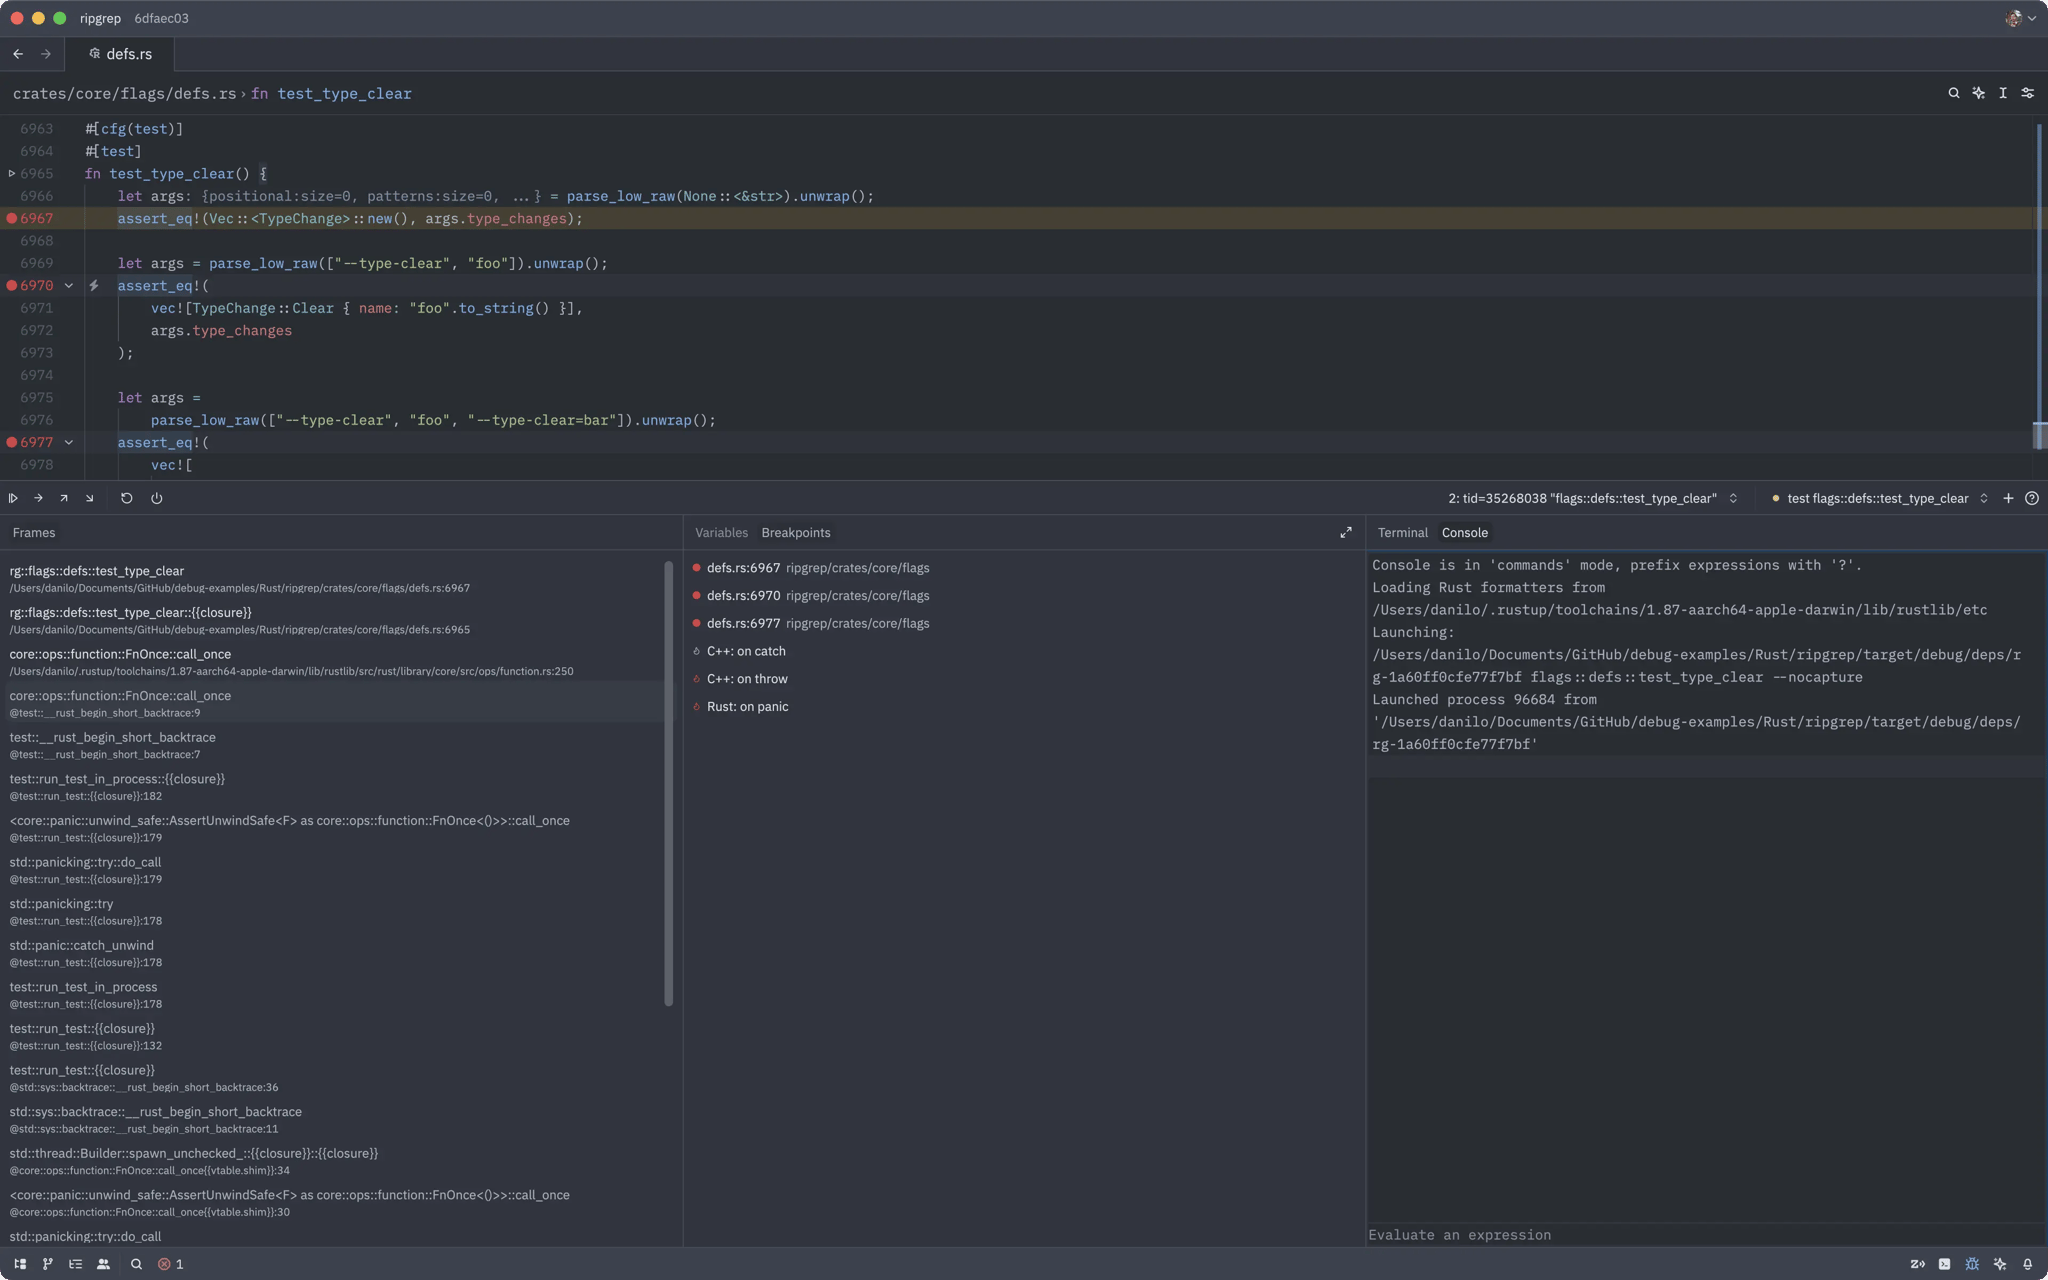
Thoughtfully integrated into Zed
From the seamless setup experience to the minimal UI, every part of Zed's debugger has been meticulously crafted.
Out of the box support
Consistent debugging
across multiple languages
Built on the Debug Adapter Protocol (DAP) for consistent debugging across most languages. Extend to fit your needs with Zed's Debug Adapter Extensions.
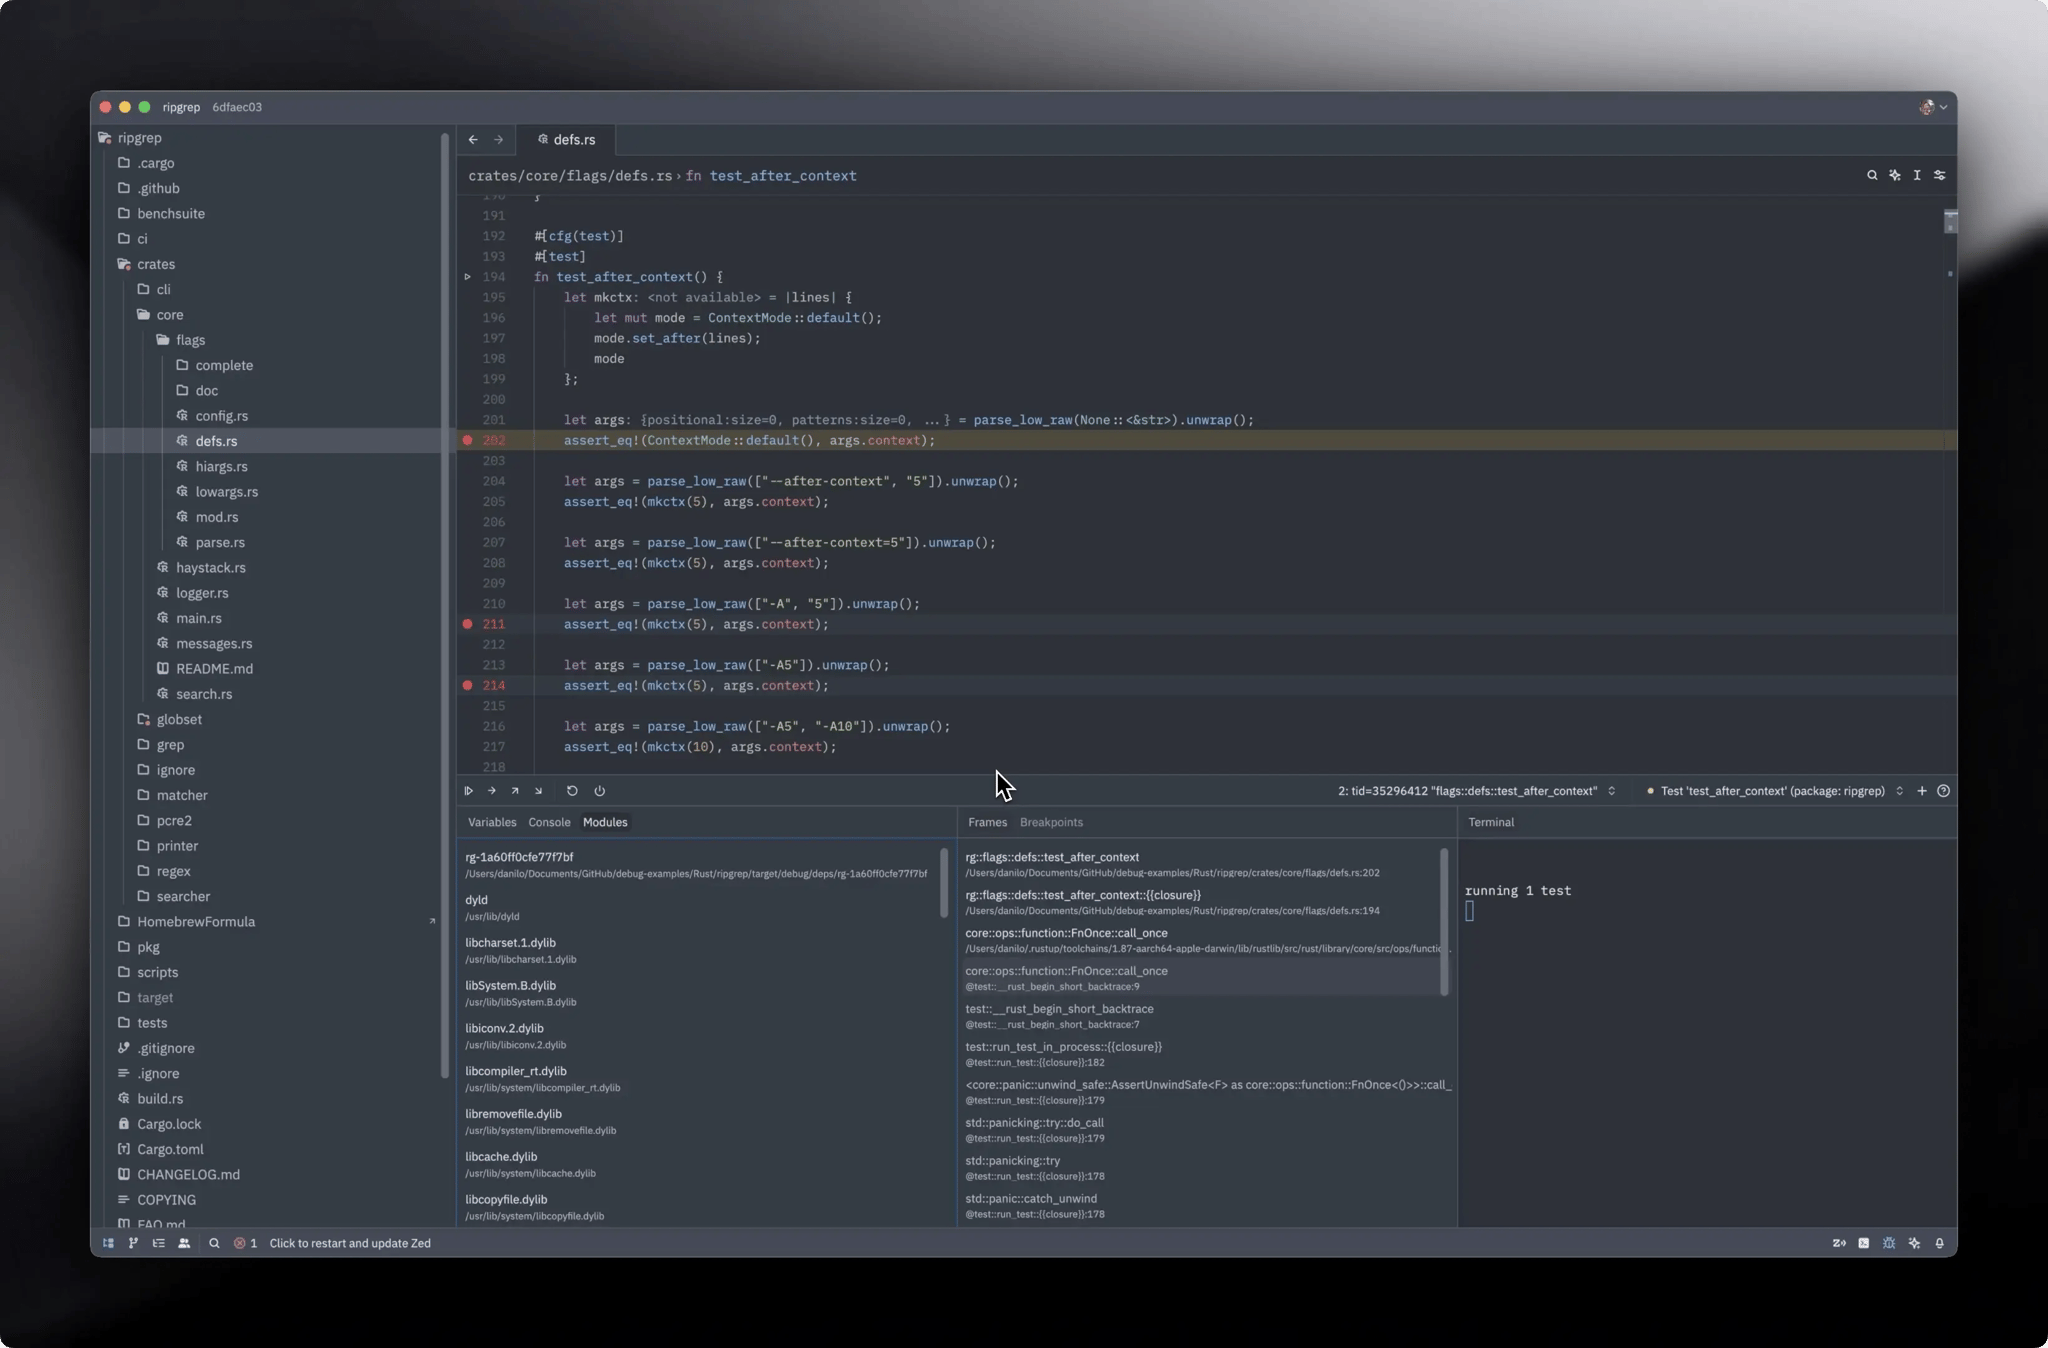
Debugging in Zed
Debug like you code: fast, minimal, and powerful.
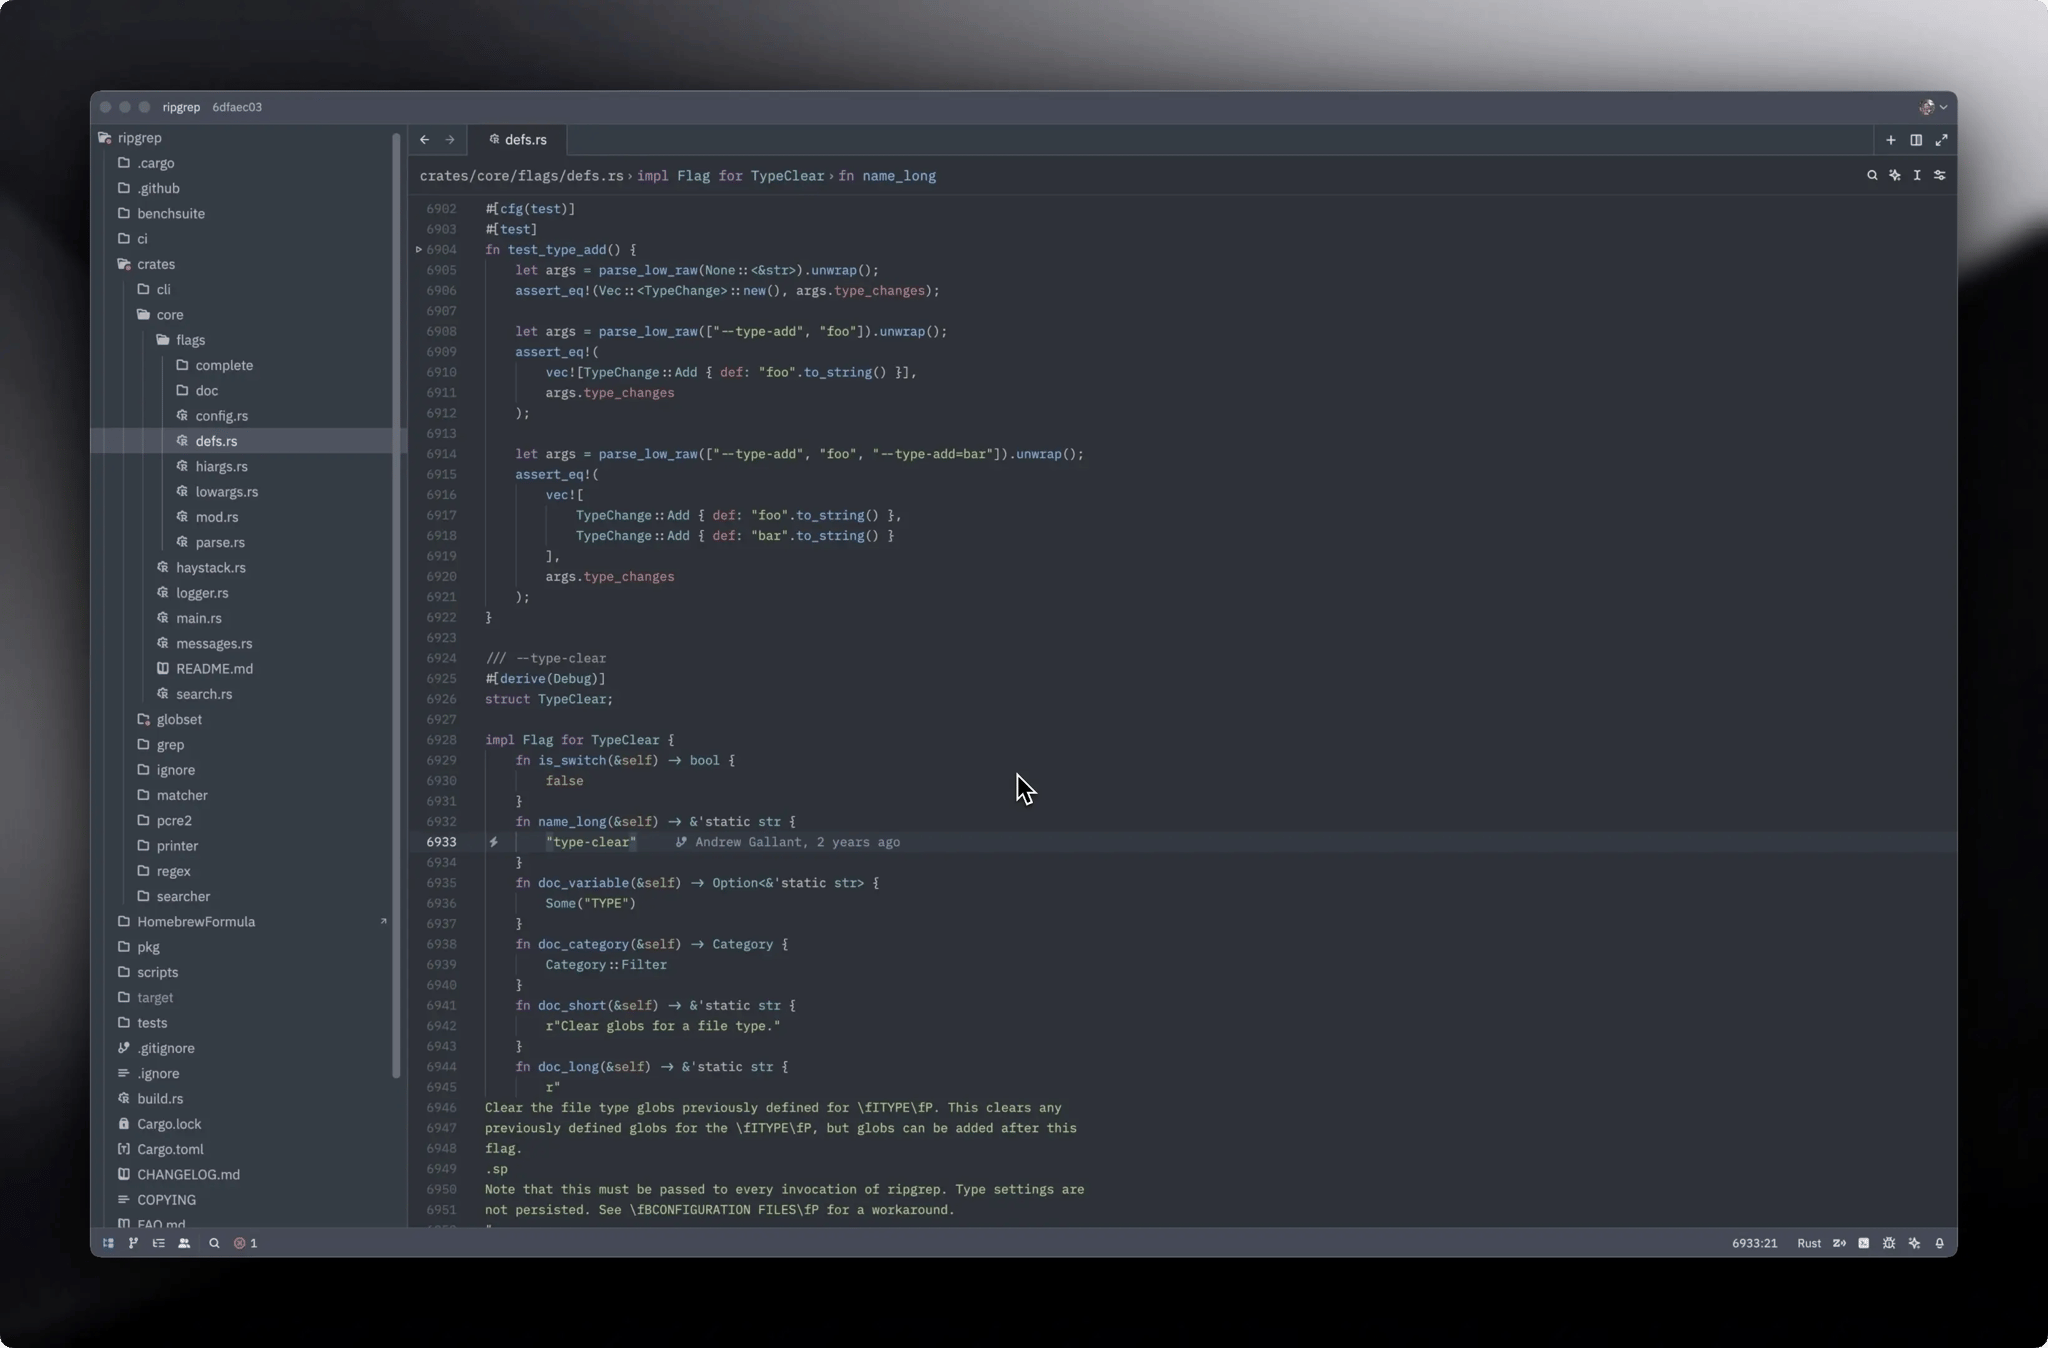
Run to cursor
Click any line and run directly to it. Perfect for quickly jumping to specific code sections or skipping over irrelevant execution paths.
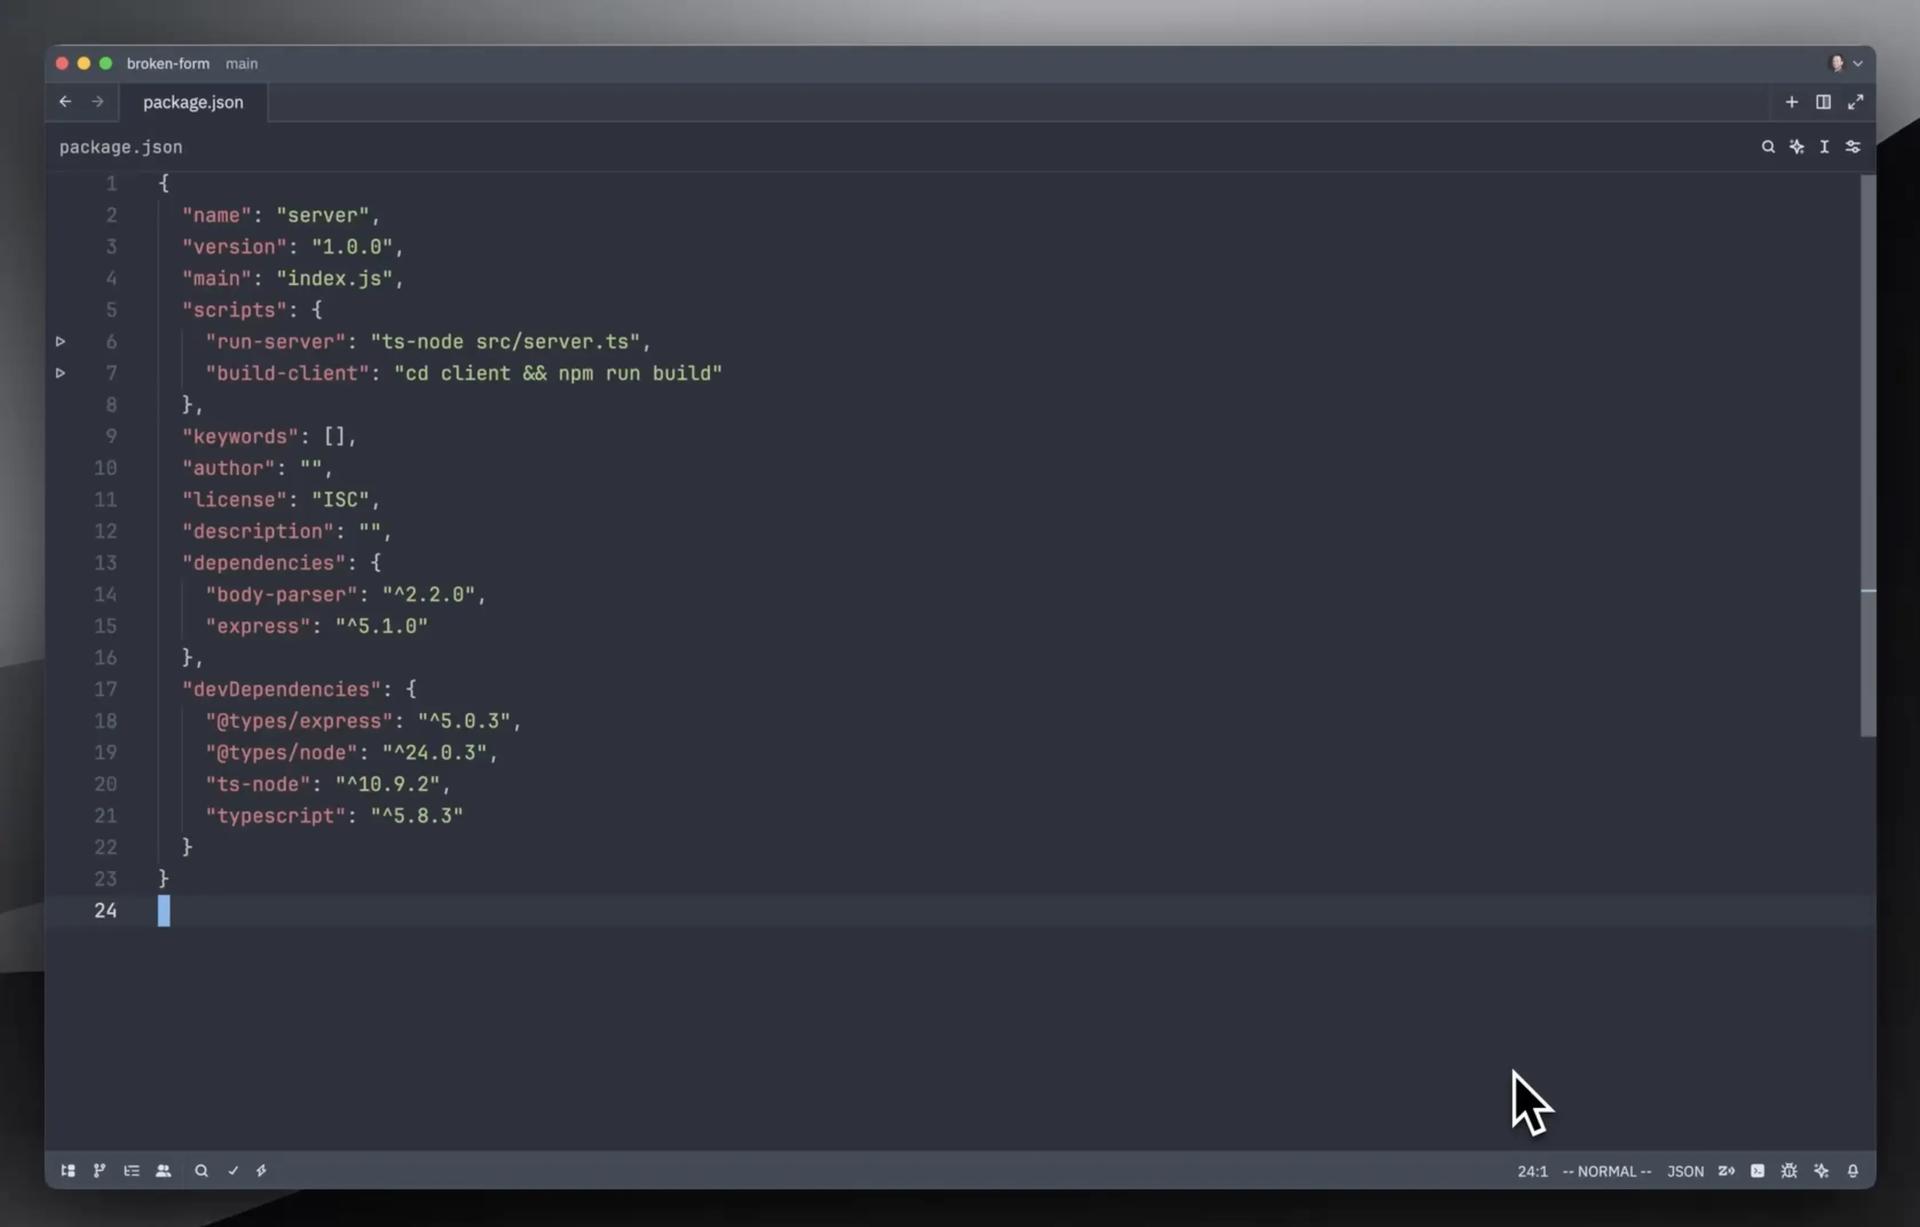
Evaluate selected expression
Select any text and evaluate it. Great for quickly checking changes in a dynamic language or the result of inline expressions.
Multiple sessions support
Run multiple debugging sessions side-by-side. Compare different execution paths and test various scenarios all within one UI.
Remote debugging
Debug seamlessly in Zed by connecting to applications running on remote servers, containers, or different machines.
Community-First
Built by the community,
for the community
In true Zed style, this debugger exists because our community made it happen.
View the Debugger PRAkos
@akoskm
basically the only reason why stopped using Zed. thanks for making this 🥹
Roy Carrilho
@RuiCarrilho5
zed has a debugger incoming?! vscode is so cooked
Adib Hanna
@Adib_Hanna
I really like zed! Im just waiting for them to add a debugger
Artur Chakhvadze
@norpadon
I am trying to move my team to Zed and the lack of debugger is currently the main pain point
moreward
@morew4rd
Once it gets the debugger support, I'll give Zed a real shot. I played with it a bit today, and it seems capable otherwise.
Thiago Holanda
@tholanda.com
Now, it is time to invest some time to bring debugger to Zed. We all know there’s an initiative running in parallel, but it is only one guy (or two or three more) working in it.
Rodrigo Pinheiro
@rodrigo-pinheiro.com
I desperately need a debugger for Zed...
hoodie
@hoodie.de
Now I've recently adopted zed as my daily driver for typescript and I find I miss a debugger 😆
crypt0x_0
@crypt0x_0
tbh once zed releases the debugger interface support there's literally no reason to be still using vscode or any of the forks
Kyle Gill
@gill_kyle
Enjoyed Zed while I was running it, but missed Agent mode + Debugger
Paul Mallach
@toolbar23
i am just waiting for Zed releasing their debugger. :-)